


How to identify carbon hotspots and turn carbon data into action
The short version: Identifying carbon hotspots means finding the suppliers, categories, products, departments, sites or activities where emissions are concentrated, where you have the most influence, or where better data would change the picture. A practical way to do it is to start with a screening view of all available emissions and spend data, rank the largest sources, test those rankings against data quality and influence, and then improve the estimates that matter most. Done well, hotspot analysis is the bridge between a carbon inventory and a useful carbon reduction plan.
This guide is written for sustainability, procurement and finance professionals who already have some carbon data — perhaps a footprint, a spend file, a supplier list or a partial Scope 3 inventory — and need to decide where to focus next.
Key takeaways
– A carbon hotspot is any area that accounts for a significant share of emissions, presents a meaningful reduction opportunity, or matters because of influence, risk or data uncertainty.
– Hotspots appear across multiple dimensions: Scope 3 categories, suppliers, procurement categories, products, departments, sites and lifecycle stages.
– GHG Protocol recommends screening Scope 3 emissions first, then refining the categories and activities that matter most for your goals.
– Spend-based analysis is useful for screening but should be tested against emissions factors, activity data and supplier-specific information where possible.
– Hotspot analysis is most valuable when it leads to ownership, supplier engagement, carbon budgets and a structured reduction plan.
What is a carbon hotspot?
A carbon hotspot is an emissions source, activity, supplier, category, product, department, site or lifecycle stage that stands out because it represents a significant share of total emissions, a significant reduction opportunity, or an area that deserves attention for other reasons — such as data uncertainty, regulatory exposure, stakeholder interest or procurement influence.
GHG Protocol frames hotspot identification as one of the core purposes of a Scope 3 inventory: companies use the inventory to understand the relative size and scale of emissions across activities in their value chain and to identify the largest sources, or “hot spots”, on which to focus reduction efforts.
A hotspot is not always the largest number on the page. A smaller emissions source can still be a hotspot if your organisation has high influence over it, if it is a regulatory or procurement priority, or if you suspect that better data would reveal a larger hidden impact.
Why hotspot analysis matters?
Most organisations now have access to some form of carbon data. The challenge is rarely measurement on its own — it is deciding what to do with the result.
A footprint number, on its own, tells you very little about where to act. A hotspot view tells you which suppliers, categories and decisions are doing most of the work, and where engagement, contract review, specification changes or operational changes are most likely to move the total.
Hotspot analysis matters for several practical reasons:
– Prioritisation: Scope 3 emissions can span 15 categories and thousands of suppliers. Hotspot analysis helps focus limited time and budget on what matters.
– Supplier engagement: Sending the same data request to every supplier rarely works. A hotspot view gives procurement teams a reasoned basis for prioritised engagement.
– Reporting: Frameworks such as ESRS E1 expect in-scope companies to identify significant Scope 3 categories using criteria including magnitude, spend, influence and stakeholder views.
– Target setting: SBTi guidance states that companies should complete a Scope 3 inventory before setting supply-chain reduction targets, and that near-term targets must include Scope 3 where it represents 40% or more of total Scope 1, 2 and 3 emissions, with coverage of at least 67% of Scope 3.
In short: hotspot analysis is what turns carbon accounting from a reporting exercise into a management tool.
Where carbon hotspots appear?
It helps to think about hotspots across more than one dimension. The same organisation can look very different depending on which lens you use.
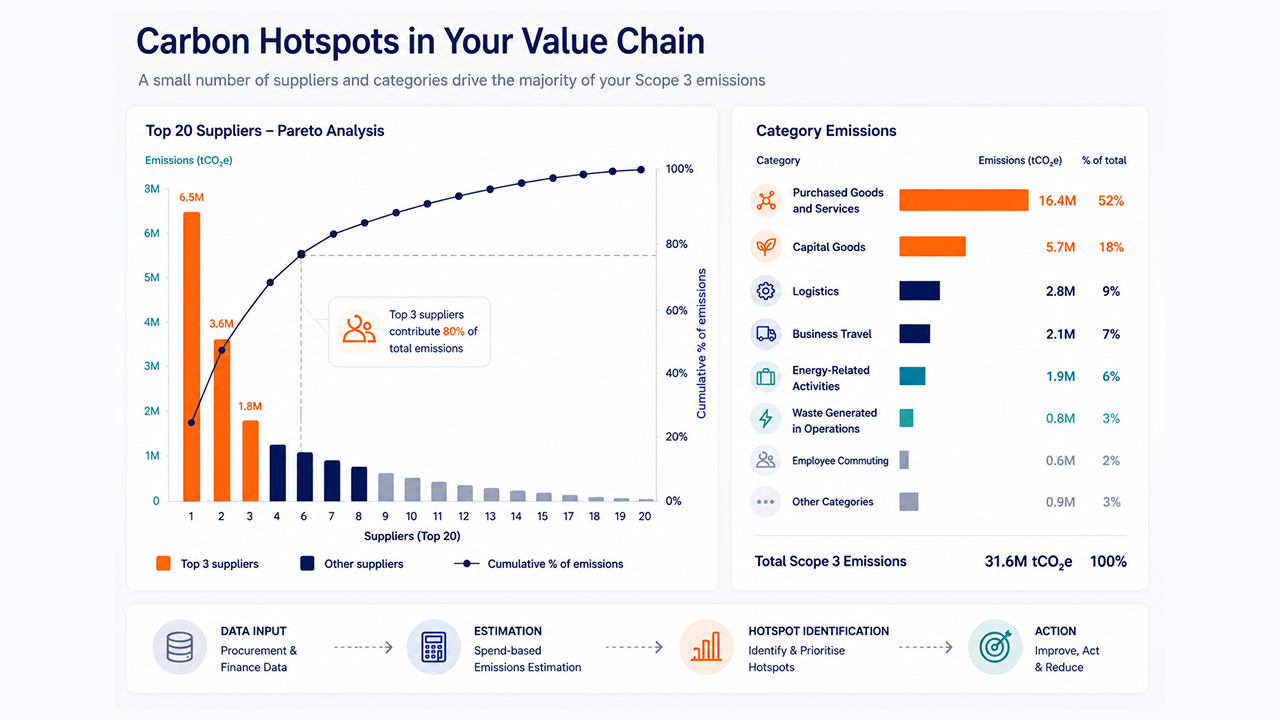
- Scope and Scope 3 category: The GHG Protocol Scope 3 Standard covers 15 upstream and downstream categories. For many organisations, a small number of these — often purchased goods and services, capital goods, fuel- and energy-related activities, business travel, or use of sold products — account for the majority of total Scope 3 emissions.
- Supplier: Within purchased goods and services, emissions are usually concentrated in a relatively small group of suppliers. Supplier-level analysis is essential for engagement and procurement decisions.
- Procurement category: Suppliers can span multiple categories, so a category view — for example, IT services, construction, medical equipment, professional services, food, logistics — often reveals patterns that a supplier list alone cannot.
- Department or business unit: Departmental breakdowns help assign ownership. A hotspot in “travel” or “estates” only becomes manageable when a named team is responsible for it.
- Site, product or project: For organisations with multiple sites, complex product portfolios or major capital projects, breaking emissions down by site, product or project often reveals decisions that would otherwise be hidden inside a total.
- Lifecycle stage: For product-level work, the Life Cycle Initiative frames hotspot analysis as a way to focus on priority lifecycle stages, actors and trade-offs. Product carbon footprints can refine hotspot views inside broad procurement categories, and approaches such as WBCSD’s PACT and the Pathfinder Framework are aimed at making primary-data-based product carbon footprints more comparable and exchangeable.
A good hotspot process usually combines several of these views rather than relying on one.
A step-by-step method for identifying carbon hotspots
There is no single approach to hotspot analysis, but the following sequence works well for most organisations.
1. Gather the available data
Pull together what you already have: emissions inventories, spend files, supplier lists, activity data (kWh, litres, tonnes, kilometres), site data, departmental cost centres and any existing Scope 3 work. You will rarely have everything; that is expected.
2. Map the data
Align it to scopes, the 15 Scope 3 categories, procurement categories, suppliers and internal business owners. This mapping step is where a lot of practical insight is created, even before any calculations run.
3. Run a screening estimate
GHG Protocol recommends starting with screening — often using less-specific data — to identify likely significant Scope 3 categories, reduction opportunities and business-goal priorities. Spend-based methods are commonly used here because procurement and finance data tends to be more complete than supplier-specific emissions data.
4. Rank by emissions magnitude, data confidence and influence
This is the heart of hotspot analysis. The largest numbers matter, but so does how reliable those numbers are and how much your organisation can actually change them.
5. Improve the estimates that matter most
For the priority suppliers, categories or activities, work to replace average or spend-based estimates with activity data, supplier-specific data, hybrid calculations or product carbon footprints. GHG Protocol describes data quality as iterative: it is acceptable to start with lower-quality data and improve it over time, especially where emissions are high and data confidence is low.
6. Assign owners
Translate hotspots into responsibilities: procurement, estates, finance, operations, travel, IT, project teams or supplier relationship leads. A hotspot without an owner rarely changes.
7. Connect findings to a reduction plan
Link the hotspot view to supplier engagement, contract review, specification changes, departmental carbon budgets and regular review cycles. Hotspot analysis is most useful when it feeds a structured plan rather than a one-off report.
Choosing the right calculation method
For purchased goods and services, GHG Protocol identifies four calculation methods: supplier-specific, hybrid, average-data and spend-based. Each has a role.
| Method | What it uses | Best used for |
| Spend-based | Financial spend and emission factors per unit of spend | Initial screening, broad prioritisation, areas with limited data |
| Average-data | Average emission factors per physical unit (kg, litre, kWh) | Category-level estimates where activity data is available but supplier data is not |
| Supplier-specific | Emissions data from the supplier for the goods or services purchased | Priority suppliers, target tracking, supplier engagement |
| Hybrid | Combination of supplier-specific and secondary data | Priority categories where partial primary data is available |
GHG Protocol lists these methods in order of specificity but notes that the most specific method is not always the best first choice. Method selection should reflect data availability, data quality, activity size and business goals. The Scope 3 Technical Guidance similarly states that more specific methods generally produce higher-quality estimates but require more effort, and that choice should weigh relative size, reduction goals and cost or effort.
In practice, most organisations move along a data ladder: spend-based screening → category averages → activity-based data → supplier-specific data → hybrid → product carbon footprints → regular tracking. You do not need to be at the top of the ladder for every category. You need to be high enough on the ladder where it matters most.
A simple framework for prioritising hotspots
A useful way to translate analysis into decisions is a 2×2 view.
Emissions size against influence:
– High emissions, high influence: first-priority reduction action — specification changes, supplier engagement, contract terms, operational changes.
– High emissions, low influence: longer-term work — collective supplier engagement, market signalling, alternative procurement strategies, data improvement.
– Low emissions, high influence: possible quick wins where action is easy and demonstrates progress.
– Low emissions, low influence: monitor or deprioritise unless strategically important.
Emissions size against data confidence:
– High emissions, high confidence: act now.
– High emissions, low confidence: improve the data before committing to specific reduction targets.
– Low emissions, low confidence: generally low priority for data improvement.
– Low emissions, high confidence: monitor.
These are simple tools, not formulas. They work because they push teams to think beyond “what is the biggest number?” and toward “where is action most likely to matter, and where do we need better evidence first?”
Common mistakes in hotspot analysis
A few patterns come up repeatedly:
– Treating the footprint as the end of the process: A total number on its own does not tell anyone what to do.
– Ranking only by spend: Spend and emissions are correlated but not equivalent. High-cost professional services may carry lower embodied emissions than lower-cost material-intensive purchases.
– Comparing suppliers calculated with different methods as if the numbers are equivalent: A supplier-specific figure and a spend-based estimate are not directly comparable.
– Asking every supplier for the same level of detail: Generic supplier surveys often produce low response rates and limited useful data.
– Ignoring data quality and uncertainty: GHG Protocol assesses quality across technological, temporal and geographical representativeness, completeness and reliability. These dimensions matter when interpreting rankings.
– Focusing only on Scope 1 and 2 actions while major Scope 3 hotspots go unaddressed: For many organisations, Scope 3 is the larger picture.
How we help
Most organisations we work with already have more useful carbon data than they realise. The challenge is that it is buried in finance systems, procurement records, invoice lines, supplier lists and site data — and a footprint number alone does not tell anyone where to focus.
With GreenInsight AI, we analyse procurement and finance data to show where emissions are concentrated across suppliers, categories, departments and projects. That gives sustainability, procurement and finance teams a shared evidence base: not just a footprint, but a practical view of which supplier relationships, which categories and which internal decisions are doing most of the work.
Our process starts with the data you already have. We build a screening view, identify the main offenders, highlight likely quick wins, and flag areas where better data would change the picture. We use supplier Pareto analysis to help teams see which supplier relationships may deserve attention first, and we break emissions down by department and category so that hotspots become someone’s responsibility rather than a line on a report.
From there, we help organisations move from measurement to action. That means connecting hotspot analysis to supplier engagement, departmental carbon budgets, regular review cycles (monthly, quarterly or yearly) and a carbon reduction plan that people inside the organisation can actually use. Our work has supported NHS organisations, universities, councils and other public-sector bodies, including engagements alongside PHS, Jisc and NHS Supply Chain, and we hold Knowledge Transfer Partnerships with the University of Reading and the Goldsmiths Cybernetics Department.
If you have a footprint, a spend file or a partial Scope 3 inventory and you are not sure where to focus next, talk to us about your procurement carbon data. We can help you turn it into a clear, prioritised view of where reductions are most likely to come from.
Frequently asked questions
- What is a carbon hotspot?
A carbon hotspot is a supplier, category, product, department, site, activity or lifecycle stage that accounts for a significant share of emissions, presents a significant reduction opportunity, or deserves attention for reasons such as influence, risk or data uncertainty. GHG Protocol uses the term in the context of identifying the largest emission sources in a value chain. - Can we identify carbon hotspots without supplier-specific data?
Yes. GHG Protocol explicitly recommends screening Scope 3 emissions first, often using less-specific data such as spend-based or average-data methods, to identify likely significant categories. Supplier-specific data is then prioritised for the areas that matter most. You do not need primary data for every supplier to make a useful start. - What is the difference between spend-based and activity-based hotspot analysis?
Spend-based analysis multiplies financial spend by an emission factor per unit of spend. Activity-based analysis uses physical activity data — such as kilograms, kilometres or kilowatt-hours — multiplied by an emission factor per unit of activity. Spend-based methods are useful for screening but can be sensitive to price differences that do not reflect emissions intensity. Activity-based and supplier-specific methods generally provide higher-quality estimates but require more effort. - Which suppliers should we engage first?
A reasoned starting point is the group of suppliers that appears in the upper end of your supplier Pareto view — the relatively small number of suppliers that account for a large share of estimated emissions in your priority categories. Engagement should be sized to influence: for the top group, that may mean direct conversations and data sharing; for the long tail, it may mean lighter-touch standardised approaches. - How often should carbon hotspots be reviewed?
There is no single right answer. Many organisations review hotspot data quarterly or annually, with deeper reviews tied to procurement cycles, budget planning or reporting periods. We often support monthly, quarterly or yearly analysis cycles so that hotspot analysis becomes part of ongoing management rather than a one-off exercise.
Conclusion
A carbon inventory is most useful when it leads to decisions. Identifying carbon hotspots — across Scope 3 categories, suppliers, procurement categories, departments, sites and lifecycle stages — is how organisations turn a footprint number into a prioritised list of where to focus. The practical approach is to screen first, rank by emissions, data confidence and influence, improve the estimates that matter most, and connect findings to owners, supplier engagement and a structured reduction plan.
This is the work we do every day. If you would like to understand which suppliers, categories and departments are driving your emissions — and what a practical reduction plan could look like — speak to us at CO2Analysis.
Make the Smart Move. Talk to Us.
Contact us for a free analysis of your overall carbon footprint and a fixed fee for the detailed analysis right down to the products and services you buy.
Book a DemoOur Locations
UK Office
The Thatched Barn, Church Lane,
Tadley, Hampshire, RG26 5LA, United Kingdom
 +44 (0)118 324 9580
 [email protected]
US Office
1207 Delaware Ave #847 Wilmington, DE 19806
+1 302 319 3304
[email protected]
Connect with us


Copyright © CO2 Analysis 2026