How to Measure Scope 3 Emissions from Procurement Data
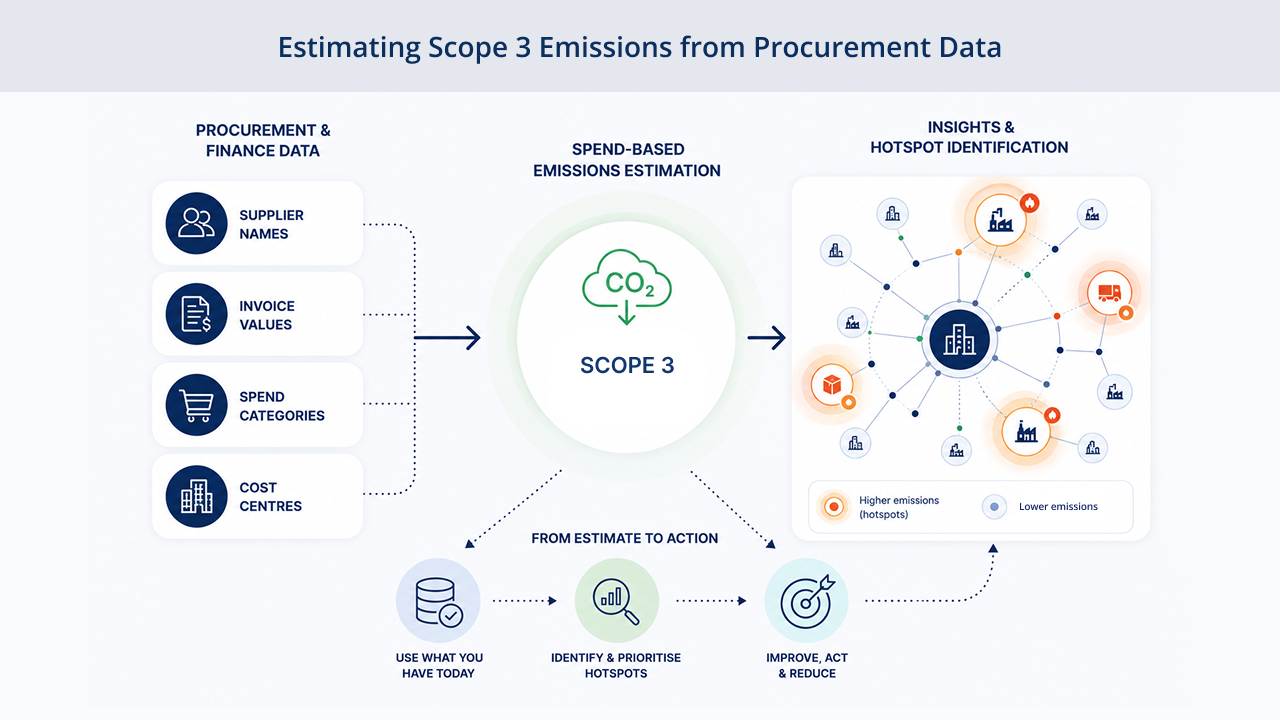
The short version: Procurement and finance data — supplier names, invoice values, spend categories and cost centres — can be used to estimate Scope 3 emissions, most directly for purchased goods and services (Category 1 of the GHG Protocol Scope 3 Standard). Spend-based calculation is a practical starting point for many organisations, but the real value comes from using that first estimate to identify carbon hotspots, prioritise better data collection and take action. This article explains how the process works, what data you need, where the limitations lie and how to move from an initial estimate towards something that genuinely supports decision-making and reduction planning.
Key Takeaways
– Purchased goods and services (Category 1) is often the largest source of Scope 3 emissions and the category most directly addressed through procurement data.
– The GHG Protocol recognises four main calculation methods for Category 1: supplier-specific, hybrid, average-data and spend-based. Spend-based methods are a practical starting point for most organisations.
– Spend-based analysis is more like a heat map than a meter reading — it helps identify where to look, not a precise product-level measurement.
– The goal is not a one-off calculation but a staged process: screen, identify hotspots, improve data quality where it matters most, and connect the results to supplier engagement and reduction planning.
– Messy procurement data is normal. Data cleaning and classification are part of the work, not a barrier to starting.
1. Why Procurement Data Matters for Scope 3 Measurement
For most organisations, the biggest share of greenhouse gas emissions does not come from their own buildings or vehicles. It comes from what they buy — the goods, materials, services and energy embedded in their supply chain. The GHG Protocol’s Scope 3 Standard, the main global framework for corporate value-chain emissions accounting, recognises 15 Scope 3 categories covering both upstream and downstream activities outside an organisation’s direct operations.
For many organisations, purchased goods and services alone can account for a substantial proportion of total Scope 3 emissions. This is precisely why procurement and finance data are such a useful starting point. Most organisations already hold supplier names, invoice values, product categories, cost centres and contract records. With the right approach, that information can be converted into a credible first estimate of supply-chain emissions — one that is useful enough to guide priorities, support reporting and begin a more structured programme of data improvement and supplier engagement.
That said, procurement data is rarely clean or complete. Supplier names are duplicated. Invoice descriptions are vague. Cost centres are inconsistently coded. Prices fluctuate. Capital goods are sometimes mixed with operating expenditure. These are real challenges, but they are not reasons to delay starting. They are simply part of the data-preparation work that makes the eventual analysis credible.
2. Which Scope 3 Categories Connect to Procurement Data
The most directly relevant category is Category 1: Purchased Goods and Services. The GHG Protocol defines this as upstream, cradle-to-gate emissions from producing the goods and services purchased or acquired by the reporting organisation in the reporting year. It does not include transport from a tier-one supplier to the reporting organisation, which typically falls under Category 4 (Upstream Transportation and Distribution).
Procurement data can also support estimates for several other Scope 3 categories, depending on what is held in the dataset:
Category 2 (Capital Goods): Significant capital purchases may warrant separate treatment from operating expenditure.
Category 4 (Upstream Transportation and Distribution): Logistics and freight spend can support estimates here.
Category 5 (Waste Generated in Operations): Waste-service invoice data may be useful.
Category 6 (Business Travel): Travel invoices or corporate card data can support estimates.
Category 7 (Employee Commuting): Payroll and location data may help.
It is important to handle category boundaries carefully to avoid double-counting. The priority for most organisations starting with procurement data is to address Category 1 thoroughly before extending the analysis.
3. The Four GHG Protocol Calculation Methods for Purchased Goods and Services
The GHG Protocol Technical Guidance for Calculating Scope 3 Emissions identifies four main methods for Category 1. Understanding the trade-offs is important for deciding where to start and where to invest in better data.
The GHG Protocol does not require every organisation to use the most specific method for every purchase from the outset. It recommends selecting methods based on factors such as the size of emissions, data availability, business goals and whether the inventory will support decision-making. The practical implication is clear: start with what you have, identify where it matters most, then improve.
Spend-based methods use the economic value of purchased goods or services, multiplied by a relevant emission factor expressed in kilograms of CO₂e per unit of currency spent. Spend-based factors are generally derived from environmentally extended input-output analysis and are available for broad economic categories. They are not product-specific, which is why spend-based results should be treated as estimates rather than precise measurements of any individual supplier or product’s real carbon impact.
4. What Procurement and Finance Data You Actually Need
You do not need a perfect dataset to begin. A useful starting point typically includes some combination of the following:
– Supplier name and supplier identifier
– Invoice date and reporting period
– Invoice line description
– Spend value, net of VAT
– Currency
– Cost centre, department or project code
– General ledger code or purchasing category
– Capital or operating expenditure classification (where applicable)
– Quantity and unit (where available)
– Region or country of supply
More granular fields — such as product specifications, delivery volumes, material weights or supplier-specific emissions reports — support a move towards average-data or supplier-specific methods later in the process. Even without them, a well-structured spend dataset can produce a useful first view of where emissions are concentrated.
The data-preparation step matters as much as the calculation itself. Inconsistent supplier names, missing categories and ambiguous cost centres make it harder to trust the results. Taking time to clean, classify and consolidate procurement records before applying emission factors produces a far more useful output.
5. A Practical Framework: Screen, Focus, Refine, Engage, Reduce
The strongest approach to procurement-led Scope 3 measurement is not a single calculation. It is a staged process.
1. Screen
Start with available procurement and finance data. Map spend to appropriate Scope 3 categories. Apply spend-based emission factors to generate an initial estimate across the full purchasing base. The purpose of this step is not precision — it is to get a credible first view of where emissions are likely to be concentrated.
2. Focus
Identify the suppliers, purchasing categories, departments and projects that appear to drive the largest share of emissions. A small number of suppliers or categories typically account for a disproportionate share. This initial heat map is where the analysis earns its keep — it tells organisations where to direct their attention rather than treating every purchase as equally important.
3. Refine
For the highest-emission areas, prioritise improving data quality. Move selected suppliers or categories from spend-based estimates towards average-data, activity-based, hybrid or supplier-specific calculations as better information becomes available. This does not need to happen everywhere at once — the GHG Protocol explicitly supports a staged approach to data-quality improvement, starting with areas where better data would most affect decisions.
4. Engage
Use the analysis to structure supplier conversations. Where a supplier contributes significantly to estimated emissions, engaging them on their own emissions reporting, reduction targets and product-level data becomes practical and evidence-based. Useful information to request from suppliers may include their Scope 1 and Scope 2 emissions, relevant Scope 3 data, methodology and assurance status.
5. Reduce
Connect the results to practical carbon reduction planning. Procurement data can identify where emissions are likely concentrated; reduction planning considers what to do about it — supplier engagement, demand reduction, specification changes, alternative products or services, procurement policy changes or departmental carbon budgets.
6. Data Quality — and How to Improve It Over Time
One of the most important points the GHG Protocol makes about Scope 3 measurement is that organisations can legitimately begin with lower-quality data when better data is not yet available. What matters is transparency about method and a commitment to improving data quality over time, especially in areas where higher-quality data would affect decisions.
A practical way to think about data-quality progression is as a ladder:
Spend-based estimate → Category-average data → Activity or quantity-based data → Supplier-specific data → Assured product or service-level carbon data
Most organisations will sit at different rungs for different parts of their spend. A large, complex supply chain may use spend-based estimates for the majority of suppliers while pursuing supplier-specific data from the handful that drive the most emissions. This is a reasonable and defensible approach.
It is also worth understanding the limitations of spend-based analysis when tracking progress. Because spend-based emissions are linked to the value of purchasing, a fall in estimated emissions may reflect reduced spending, price changes, inflation adjustments or supplier reclassification rather than a genuine reduction in carbon. Research for the Scottish Government by ClimateXChange found that spend-based methods are widely used and useful for identifying hotspots in public-sector supply chains, but are limited for reliably tracking emissions reductions over time. This is a useful caution: spend-based analysis is a starting point, not a complete reduction-tracking tool.
7. Common Mistakes to Avoid
1. Treating spend-based results as precise product-level measurements
Spend-based estimates are screening tools. They identify where emissions are likely concentrated, not the exact carbon footprint of any specific product or service. Decisions about supplier engagement and data improvement should be guided by these results, not driven by misplaced confidence in their precision.
2. Conflating a fall in spend with a fall in emissions
If purchasing volumes drop, if a price falls, or if a category is reclassified, spend-based emissions will change — but that does not necessarily mean real-world decarbonisation has occurred. Tracking genuine reductions requires moving towards activity-based or supplier-specific data for priority areas.
3. Skipping data cleaning and classification
Poor data quality produces unreliable results. Duplicate supplier names, missing categories and inconsistent cost centres reduce confidence in the analysis and make it harder to prioritise sensibly. Treating data preparation as a one-off cost rather than an ongoing process compounds the problem.
4. Calculating once and stopping
A Scope 3 inventory from procurement data is most valuable as the start of a recurring process — not a one-off compliance exercise. Annual or quarterly analysis, combined with staged data improvement, delivers far more useful insight over time.
5. Ignoring double-counting risk across categories
If freight costs are embedded in supplier invoices and also tracked as a separate logistics spend, there is a risk of counting those emissions twice. Category boundaries need careful handling, especially as the analysis expands beyond Category 1.
8. How We Help
Most organisations already hold more useful carbon data than they realise. The challenge is that it tends to live in finance systems, procurement platforms, accounts payable records and supplier lists — spread across cost centres, entities and financial periods, rarely in a format that makes supply-chain emissions immediately visible.
We help turn that messy starting point into a clearer, more practical picture.
With GreenInsight AI, we analyse procurement and finance data to show where supply-chain emissions are concentrated across suppliers, categories, departments and projects. Our approach moves beyond a single Scope 3 total to the questions that procurement, sustainability and finance teams actually need to answer: which suppliers drive the most emissions? Which categories should we focus on first? Where should we invest in better data?
We work with organisations that have complex, fragmented or high-volume procurement datasets — including NHS and public-sector organisations, universities, large commercial businesses and supply-chain-heavy industries. Our process typically starts with data ingestion and cleaning, maps spend to appropriate Scope 3 categories, applies relevant emission factors and identifies hotspots at supplier, category and department level. We can also support Pareto analysis, departmental carbon budgets and flexible reporting outputs compatible with Excel and Power BI workflows.
Where spend-based estimates are the only realistic starting point, we make the limitations clear and help identify the suppliers and categories where moving to better data would make the most difference. Rather than treating Scope 3 measurement as a one-off reporting exercise, our aim is to connect the results to supplier engagement, procurement decisions and a practical carbon reduction plan.
If you are working through how to turn your procurement data into actionable Scope 3 insight, we would be glad to talk through what is realistic with your current data.
Talk to us about your Scope 3 procurement data.
9. Frequently Asked Questions
- Is spend-based carbon accounting an acceptable method for Scope 3?
Yes. The GHG Protocol explicitly recognises spend-based methods as one of four approaches for calculating Category 1 emissions, and accepts that organisations will use lower-quality data when better data is not yet available. Spend-based results should be clearly described as estimates and improved over time, particularly for high-emission areas. They are a legitimate and widely used starting point, not a workaround.
- What procurement data do I actually need to get started?
At a minimum, supplier names, spend values and a purchasing period are enough to begin. Adding cost centre codes, purchasing categories and a capital/operating classification makes the analysis considerably more useful. Quantity, unit and product description data allow a transition towards activity-based methods for priority spend areas. You do not need a perfect dataset to start — but you do need to invest time in cleaning and classifying what you have.
- How do I avoid double-counting Scope 3 emissions from procurement data?
Double-counting most commonly occurs where the same spend appears in multiple categories — for example, where freight costs are embedded in product invoices and also captured as a separate logistics line. The GHG Protocol provides category boundary guidance to help distinguish Category 1 (goods and services) from Category 4 (upstream transport) and other categories. A clear category-mapping process before applying emission factors helps manage this risk.
- How can I track genuine carbon reductions if I am using spend-based methods?
This is one of the genuine limitations of spend-based analysis. Because estimates are tied to spend, they can move up or down due to price changes, demand shifts or reclassification rather than real changes in emissions. Tracking genuine reductions over time typically requires moving key suppliers or categories towards activity-based or supplier-specific data — and being transparent about what has changed between reporting periods and why.
- Which suppliers should I engage with first?
Start with the suppliers that appear to contribute the most to estimated emissions in the initial screen. A Pareto analysis often reveals that a relatively small number of suppliers or categories account for a disproportionately large share. These are the relationships where better supplier data, product-level carbon information or reduction commitments are most likely to make a meaningful difference to the overall inventory.
10. Conclusion
Procurement and finance data are, for many organisations, the most practical entry point into Scope 3 measurement. The GHG Protocol’s spend-based method makes it possible to convert existing supplier and invoicing records into a first, useful estimate of supply-chain emissions — even before detailed product data or supplier emissions reports are available.
But the value of that first estimate lies in what it reveals, not the number itself. A credible procurement emissions analysis identifies which suppliers, categories and departments are likely to be driving emissions, shows where the data needs to improve and provides a practical basis for supplier engagement and carbon reduction planning.
The process works best when it is treated as ongoing rather than one-off: screen the full supply base, identify hotspots, progressively improve data quality where it matters most and connect the results to procurement decisions and reduction commitments.
We help organisations work through each stage of this — from data preparation and category mapping to supplier-level analysis and carbon reduction planning. If you are ready to understand what your procurement data can tell you about your Scope 3 footprint,
we would be glad to help you find out.



 +44 (0)118 324 9580
 [email protected]


